
☰
All servicesLocal SEOGBP managementAEO | GEOSEO contentTechnical SEOLink buildingDesign & CROPPC managementIndustriesLaw firmsHome servicesPlumbersHVACElectriciansRoofersMedical practicesOrthopedicsPhysical therapyDental practicesGeneral dentistsOrthodontistsPeriodontistsEndodontistsRestaurants and coffee shopsTour operatorsAuto repair shopsLocationsPennsylvaniaState CollegeBellefonteAltoonaWilliamsportLock HavenLewistownPhiladelphiaPittsburghAllentownHarrisburgNew YorkNew York CityBuffaloRochesterAlbanyTexasHoustonDallasSan AntonioAustinUtahSalt Lake CityProvoSt. GeorgeConnecticutBridgeportNew HavenHartfordStamfordOhioColumbusClevelandCincinnatiWashingtonSeattleSpokaneTacomaNevadaLas VegasRenoHendersonPackagesAboutResourcesArticles
Home / Digital marketing / Local SEO / Guides / How to read a map grid report
How to read a map grid report
What the colors, numbers, and patterns mean, and the questions to ask about your own report.
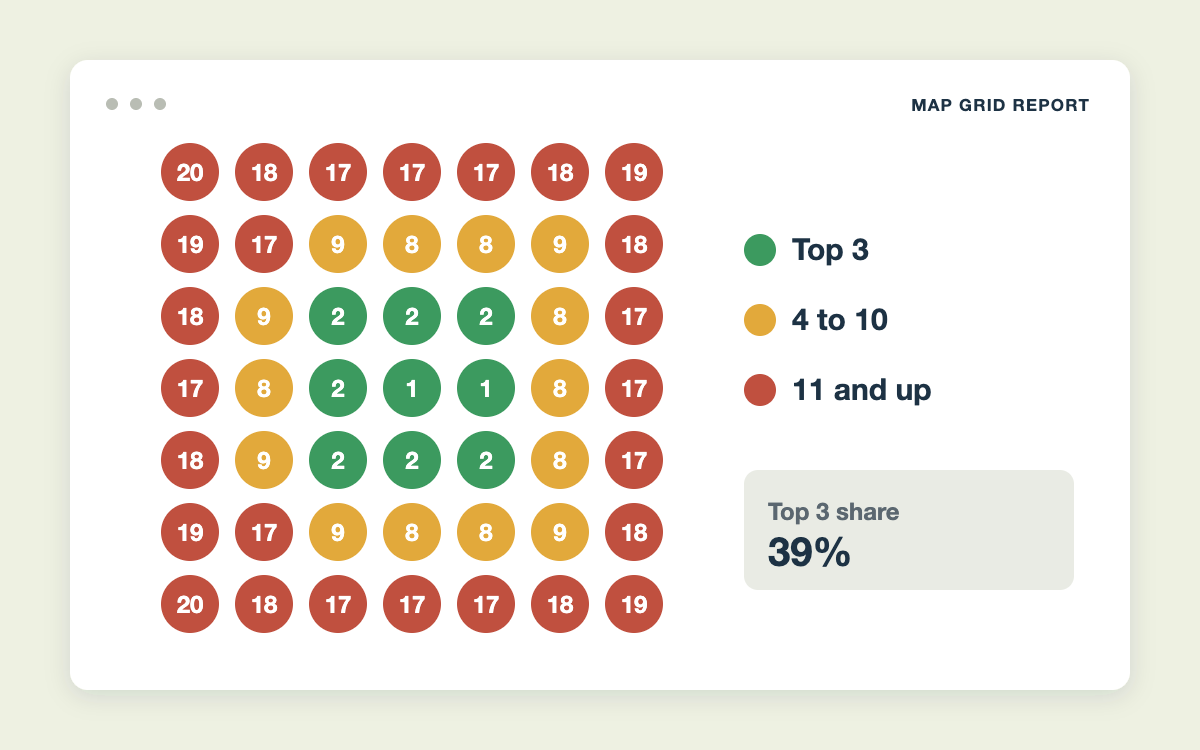
A grid report runs the same search from dozens of points around your business. This reference explains the colors, the numbers most reports give you, what the common patterns mean, and how six grid scan tools differ.
PDF, 3 pages. Free with your email.
What's inside
- What a grid report shows
- What the patterns mean
- Grid scan tools compared
Who it's for
Business owners who receive grid reports from an agency, or who are about to see one for the first time.
Common questions
Do all grid tools give the same numbers?
No. Grid size, cut-off depth, and how missing points are counted all differ, so compare a scan only with earlier scans from the same tool and setup.
What is a good top-3 share?
It depends on grid size and competition. Growth month over month matters more than the starting number.
Why do I rank first at my office and poorly elsewhere?
Google favors businesses close to the searcher, so rankings fade with distance.
How often should a scan run?
Monthly, on the same day and time, with the same keywords and grid.
Want it done for you?
This guide supports our local SEO services. To see where you stand first, request an audit.
More guides: all tools and resources