
Quick summary: A zip code or city-level rank check reports one position from one point, which hides how much map rankings change across a service area. A grid rank scan checks your position from dozens of points on a map and shows where you rank in the top three and where you do not. Use grid scans to measure visibility, and use calls and direction requests to measure results, over 60 to 90 day periods.
"We rank number one" is the most common claim in local SEO reporting, and often the least useful. In Google Maps, rank depends on where the searcher is standing.
This guide compares the two tracking methods and explains what to measure to know whether local SEO is paying off.
Why is a single rank check misleading?
Google personalizes map results by location. Proximity to the searcher is the second-ranked local pack factor in Whitespark's 2026 report, behind only primary category.
A business can rank first for a search made at its front door and twelfth for the same search made three miles away. A single check captures one of those positions and reports it as the whole picture.
Searching from your own office gives the most flattering result possible. It is the one spot where proximity favors you most.
What is zip code ranking?
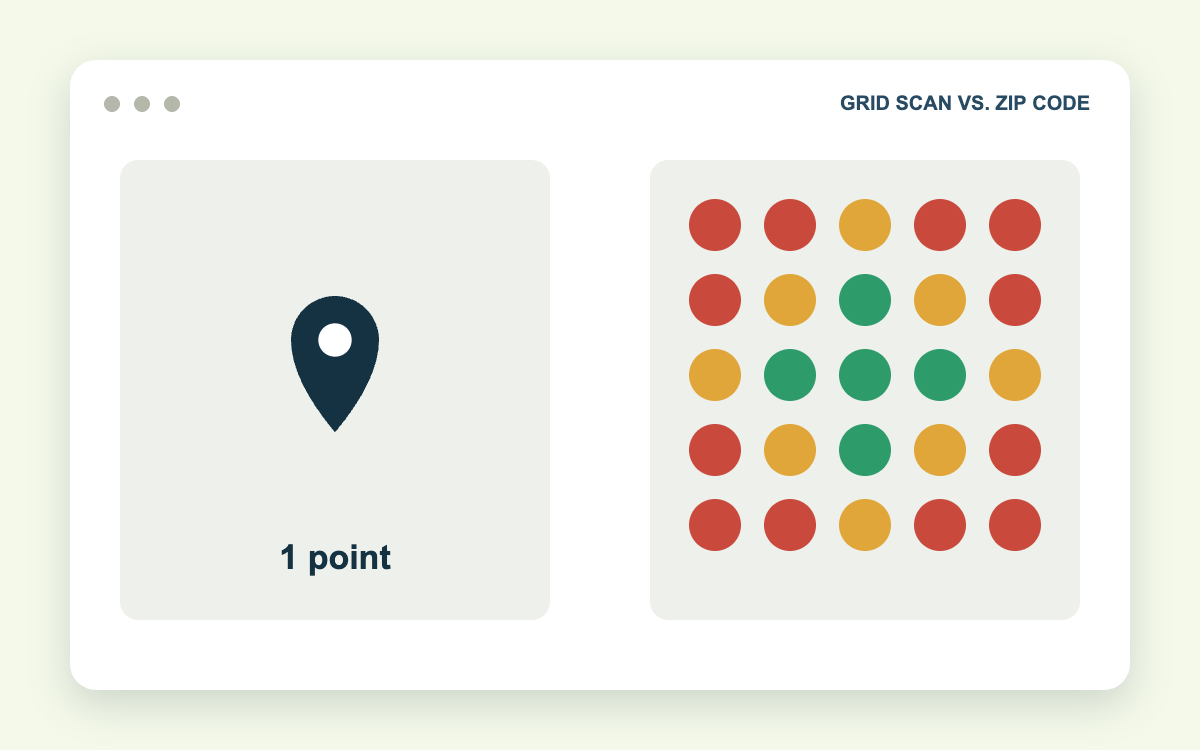
Zip code ranking, sometimes called city-level tracking, checks your position for a keyword from one simulated location, usually the center of a zip code or city.
It works well for organic website rankings, which change little within a city. It works poorly for map rankings, which change block by block.
A zip code can cover many square miles. One number for that area averages away the detail you need.
What is a grid rank scan?
A grid rank scan, also called geo-grid tracking, places a grid of points over a map of your service area. The tool runs your keyword from each point and records your map position there.
The result is a map of colored pins:
- Green (1 to 3): you appear in the local pack
- Yellow or orange (4 to 10): visible only if the searcher opens the full map list
- Red (11 and beyond): effectively invisible
Tools that produce these scans include Local Falcon, BrightLocal, Places Scout, and Local Viking.
Grid rank scans vs. zip code ranking
| Zip code ranking | Grid rank scan | |
|---|---|---|
| Data points | One per zip or city | 49 to 169 or more per keyword |
| Shows variation within a city | No | Yes |
| Best for | Organic website rankings | Google Maps and local pack |
| Reveals competitor strength by area | No | Yes |
| Output | A single number | A visual map |
| Risk | False confidence | More data to interpret |
Use both. Zip or city tracking for your website's organic keywords, and grid scans for your Google Business Profile.
How do you set up a grid scan?
The settings decide whether the scan is useful.
Grid size. A 7x7 grid gives 49 points and suits most single-location businesses. Larger service areas may need 9x9 or 13x13.
Radius. Set the distance between points so the grid covers the area where your customers live, beyond the spots where you already rank. A dentist might cover three to five miles. A roofer or attorney might cover 15 or more.
Keywords. Track three to five terms that produce revenue, such as your primary category plus your top services. Rankings differ a great deal between "plumber" and "water heater installation."
Schedule. Scan on the same day and time each month. Rankings shift by time of day, in part because open hours affect results.
A scan that covers only two miles around your office will look mostly green and tell you little. Extend the grid until you can see where the green ends.
Which numbers on a grid report matter?
- Average rank: the mean position across all points. Useful as a trend, not as a goal.
- Top-three coverage: the share of points where you rank in the pack. Tools call this Share of Local Voice or a similar name. This is the number to grow.
- Edge of visibility: the distance at which pins turn from green to yellow.
- Competitor overlap: who holds the green pins where you do not.
For a full walkthrough of reading these reports, see how to read a map grid report.
Rankings are not results: what else should you measure?
A greener map means more people see you. It does not prove more people called. Pair grid scans with action data.
Google Business Profile Performance (formerly called Insights) reports:
- Calls from the call button
- Direction requests
- Website clicks
- Messages and bookings, where enabled
- The search terms that showed your profile
Call tracking and your CRM report what happened next: answered calls, booked jobs, and revenue.
| Metric | What it tells you | Review cadence |
|---|---|---|
| Top-three grid coverage | Visibility across your area | Monthly |
| GBP calls and direction requests | Whether visibility becomes action | Monthly |
| Tracked calls and forms | Total qualified leads | Monthly |
| Booked jobs and revenue | Business outcome | Quarterly |
How long should you wait to judge local SEO ROI?
Evaluate over 60 to 90 days. Map rankings move in steps, and single-week changes are often noise from Google testing results.
A reasonable timeline:
- Day 0: baseline grid scans, GBP Performance numbers, and tracked call counts.
- Days 1 to 30: foundational fixes such as category, hours, citations, and review requests. Expect small changes.
- Days 30 to 60: top-three coverage near your location should start to widen.
- Days 60 to 90: calls and direction requests should rise with coverage. If visibility is up and calls are flat, look at the listing and website.
A simple ROI check: take the increase in monthly booked jobs from organic and map sources, multiply by average job value, and compare it with the monthly cost of the work.
For example, if top-three coverage grows from 20% to 45% of grid points and tracked calls rise from 30 to 48 a month, the 18 extra calls are the return. At a 40% booking rate and a $600 average job, that is roughly $4,300 in added monthly revenue. Substitute your own figures.
What should a local SEO report include?
If you work with an agency, ask for these every month:
- Grid scans for the same keywords, grid, and radius as the baseline
- Top-three coverage, with the change from the prior month
- GBP calls, direction requests, and website clicks
- Tracked calls and form submissions by source
- The work completed and what is planned next
Be cautious with reports that show a single "ranked number one" keyword, a grid too small to show weak areas, or ranking gains without any call data.
Free guide: How to read a map grid report. The color bands, the key numbers, seven common patterns, and six grid scan tools compared.
Frequently asked questions
How often should I run a grid rank scan?
Monthly is enough for most businesses. Weekly scans are useful during the first 90 days of a campaign or after a major change such as a new address.
What is a good average map rank?
It depends on grid size and competition. Top-three coverage is more useful: aim to grow the share of points where you appear in the pack, month over month.
Why do my grid results change from day to day?
Google tests results constantly, and factors such as open hours, new reviews, and competitor changes shift rankings. Judge trends across months.
Can I rank in the top three across my whole city?
Rarely in a large city. Proximity limits how far one location reaches. Additional staffed locations, organic city pages, and ads extend coverage beyond that range.
See your own grid
We baseline every campaign with grid scans and report on coverage, calls, and booked leads each month. That reporting is built into our local SEO services and GBP management.
Where your grid shows gaps too far from your address to close organically, PPC management can cover those areas.
Contact Galli Local to request a grid scan for your top three keywords. You will see where you rank across your service area and which competitors hold the areas you do not.
Sources: Whitespark Local Search Ranking Factors, Google: Business Profile performance